Archive

PowerBI

Even though the world is round, it does not mean that you have to look at it that way all of the time. PowerMap has a cool feature that allows you to switch from the globe view to a flat earth view.

NOTE: This is part of the Using PowerBI to Analyze Dynamics AX Data blueprint series where we show how to use PowerView, PowerPivot & Power Map to analyze and visualize your data more effectively. If you want to see all of the other posts in this series, click
here.

Read More

Advertisement

As you zoom in on the maps, you may want to see information about the areas that you are looking at. You can easily do this by turning on the map labels.

NOTE: This is part of the Using PowerBI to Analyze Dynamics AX Data blueprint series where we show how to use PowerView, PowerPivot & Power Map to analyze and visualize your data more effectively. If you want to see all of the other posts in this series, click
here.

Read More

Up until now we have just been looking at the data from one data table within Dynamics AX. If you want to merge multiple tables together, then you don’t have to resort to using SQL statements, or building complicated queries, you can use PowerQuery to merge the data for you.

NOTE: This is part of the Using PowerBI to Analyze Dynamics AX Data blueprint series where we show how to use PowerView, PowerPivot & Power Map to analyze and visualize your data more effectively. If you want to see all of the other posts in this series, click
here.

Read More

You don’t have to look at the map data just as columns, you can also use PowerMap to show the data as bubble plots, heat maps, and also as regions by changing the map type.

NOTE: This is part of the Using PowerBI to Analyze Dynamics AX Data blueprint series where we show how to use PowerView, PowerPivot & Power Map to analyze and visualize your data more effectively. If you want to see all of the other posts in this series, click
here.

Read More

Although the PowerView map functions are nice, PowerMap is a much better way to visualize information geographically.

NOTE: This is part of the Using PowerBI to Analyze Dynamics AX Data blueprint series where we show how to use PowerView, PowerPivot & Power Map to analyze and visualize your data more effectively. If you want to see all of the other posts in this series, click
here.

Read More

Another of the PowerBI tools is PowerQuery. This is an incredibly useful tool, because it allows you to query and massage data directly within Excel. This is especially useful if you only want to report off some of the data, or if you want to pre-filter the data.

NOTE: This is part of the Using PowerBI to Analyze Dynamics AX Data blueprint series where we show how to use PowerView, PowerPivot & Power Map to analyze and visualize your data more effectively. If you want to see all of the other posts in this series, click
here.

Read More

One of the easiest ways to map your Dynamics AX data is through PowerView directly from within Excel. PowerView will automatically recognize geographic columns as mappable data elements, and will translate them to the map view.

NOTE: This is part of the Using PowerBI to Analyze Dynamics AX Data blueprint series where we show how to use PowerView, PowerPivot & Power Map to analyze and visualize your data more effectively. If you want to see all of the other posts in this series, click
here.

Read More

Everyone has used Pivot Tables within Excel at one point in time to create simple reports against Dynamics AX, and some of you may have also used Power Pivot to create more elaborate dashboards and charts.  Recently Microsoft extended out the query and reporting capabilities within Excel with the Power BI suite.  In addition to extending the Power Pivot capabilities, they also added three more tools called Power Query, Power View & Power Map, and that means that you have a whole new set of reporting options.

In this presentation we will show you how you can use all of the Power BI tools to analyze your Dynamics AX data.

Read More

Perhaps you have heard about the new tool in Excel called PowerPivot, but wonder how it can enhance your use of Excel.

In this series we will show how PowerPivot can assist you with advanced data analysis and reporting, making those extracts from Dynamics AX to Excel even more valuable.

Read More

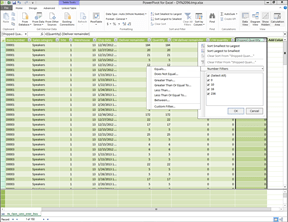
Within the PowerPivot Data Model editor, you can also filter the data that is returned to Excel through the filtering option.

NOTE: This is part of the Using PowerPivot to Analyze Your Dynamics AX Data blog series where we show how PowerPivot can assist you with advanced data analysis and reporting, making those extracts from Dynamics AX to Excel even more valuable. If you want to see all of the other posts in this series, click here.

Read More