
Everyone has used Pivot Tables within Excel at one point in time to create simple reports against Dynamics AX, and some of you may have also used Power Pivot to create more elaborate dashboards and charts. Recently Microsoft extended out the query and reporting capabilities within Excel with the Power BI suite. In addition to extending the Power Pivot capabilities, they also added three more tools called Power Query, Power View & Power Map, and that means that you have a whole new set of reporting options.
In this presentation we will show you how you can use all of the Power BI tools to analyze your Dynamics AX data.

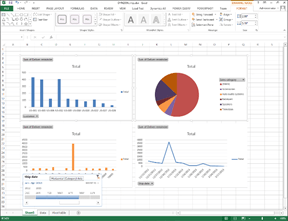 PowerPivot has a couple of extra features that you can take advantage of while you are building your dashboards for slicing and filtering your data. One is called a Timeline Slicer.