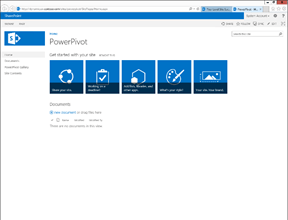
 PowerPivot has a very cool feature that allows you to publish your data to PowerPivot Galleries within SharePoint. This allows users to access and report off the data that you build within Excel, but do it all through the Web. In order to enable this feature, you first need to create a PowerPivot Gallery in SharePoint.
NOTE: This is part of the Using PowerPivot to Analyze Your Dynamics AX Data blog series where we show how PowerPivot can assist you with advanced data analysis and reporting, making those extracts from Dynamics AX to Excel even more valuable. If you want to see all of the other posts in this series, click here.
Read More

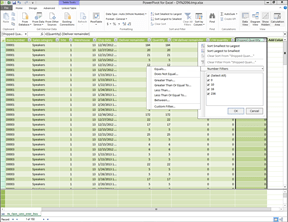 Within the PowerPivot Data Model editor, you can also filter the data that is returned to Excel through the filtering option.
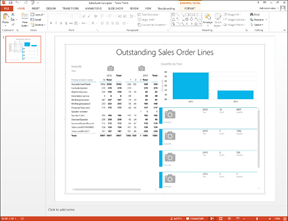 Once a PowerView Dashboard is hosted within the PowerPivot Gallery, there is one cool feature that you can take advantage of which allows you to export any of the dashboards to PowerPoint and then have a live and interactive version of the dashboard as a PowerPoint slide.
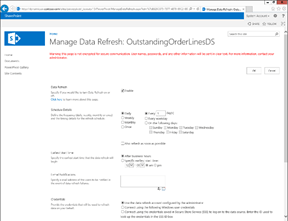 When the Power Pivot Data Models are stored within a PowerPivot Gallery, you will want to have them periodically refresh to get the latest information. Rather than doing this manually, you can configure a default refresh rate and the gallery will do the rest for you.
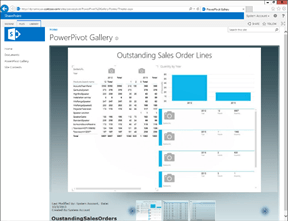 If you want to show off, you can also change the style of the PowerView Gallery to Carrousel, Theatre, or List mode depending on where you are embedding the view.
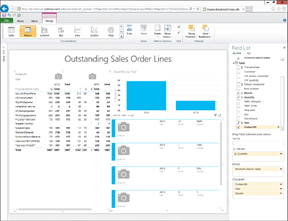 The real benefit of hosting your PowerPivot workbooks within a PowerPivot Gallery is that people can then report off the data source as if it were a mini data warehouse using PowerView.
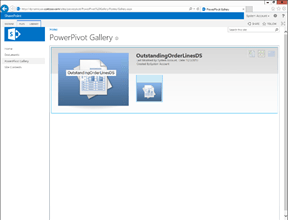 Once you have created your PowerPivot Gallery, you can publish the PowerPivots that you create within Excel there and host them within SharePoint.
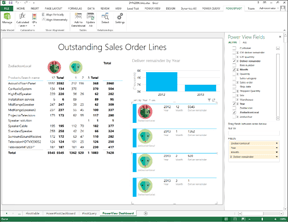 There are a number of different types of columns types that you can define within the PowerPivot manager, which act differently based depending on where they are used. One example are the Image column types. If you have a column that links to an image file then you can use it within your dashboards to spice things up a little.
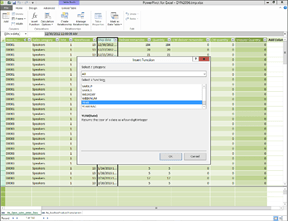 Just as you can do within Excel, you can also use any of the built in functions within the Data Model designer. This allows you to perform string and date manipulation as you create new column definitions, giving you more reporting options than are available within the default tables.