Creating PowerView Dashboards from the PowerPivot Gallery Data Sources
 The real benefit of hosting your PowerPivot workbooks within a PowerPivot Gallery is that people can then report off the data source as if it were a mini data warehouse using PowerView.
NOTE: This is part of the Using PowerPivot to Analyze Your Dynamics AX Data blog series where we show how PowerPivot can assist you with advanced data analysis and reporting, making those extracts from Dynamics AX to Excel even more valuable. If you want to see all of the other posts in this series, click here.
HOW TO DO IT
To create a PowerView dashboard from a PowerPivot data source, follow these steps:
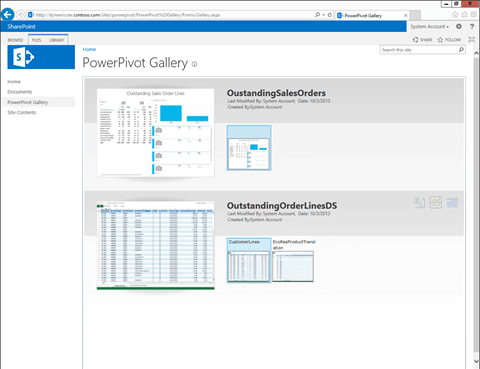
- Within the PowerPivot Gallery, if you select a data source, you will be able to see three icons to the right of the selection. Click on the middle one that is captioned Create Power View Report to launch the PowerView report designer.

HOW IT WORKS
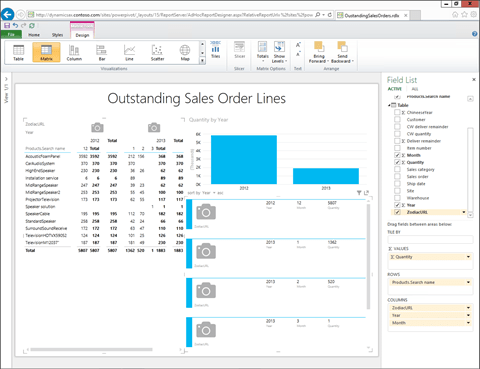
The gallery will be replaced with a PowerView Reporting Canvas with the fields from the PowerPivot being displayed as reporting fields.

You can build the PowerView dashboard through the web interface in just the same was as we built them from within Excel.
After you have created the dashboard, click on the File menu, and then select the Save As option to save your dashboard back to your PowerPivot Gallery.
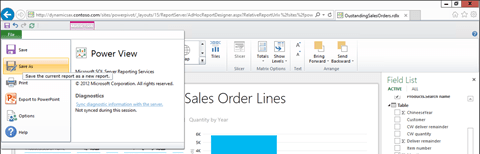
All you need to do is save give your dashboard a name and click the Save button.

Now you will see the report that you generated within the PowerPivot Gallery alongside the PowerPivot Data Source.